
Washington, D.C. Metro and Baltimore Metro Areas – April 2022 Housing Market Update
The median sales price in the Baltimore Metro increased by 9.1% compared to a year ago, and inventory may be starting to stabilize in the Washington D.C. Metro, with month-end active listings increasing by 24.5%.
May 11, 2022
Rockville, Md. (May 11, 2022) – The following analysis of the Washington, D.C. Metro and Baltimore Metro Area housing markets has been prepared by Bright MLS and is based on April 2022 Bright MLS housing data.
DC Metro Area - Overview

Home price growth was strong in the Washington D.C. region in April, with particularly fast price appreciation in some of the region’s suburban markets.
- The Bright MLS | T3 Home Demand Index rose five percent to 126 reflecting a Moderate pace of demand for Washington Metro area homes. Although demand has risen each month during the spring homebuying market, the Index has remained below the level one year earlier. Higher mortgage rates, decreased affordability and limited inventory have all contributed to lower demand this spring compared with last spring.
- In April, the region’s median sale price increased by 9.2% compared to a year ago, which is up by $50,000. The region’s median sales price is now $166,000 higher than it was five years ago.
- The number of home sales in the Washington DC region has declined year-over-year for five consecutive months. In April, the number of sales was down 17.7% compared to a year ago. Sales were up between March and April; however, the month-to-month increase was lower than it is during typical years.
- There are signs that inventory may be starting to stabilize in the region. Between March and April, the number of month-end active listings increased by 24.5%, which is higher than what it would be during a typical year.
View the Monthly Market Report
Baltimore Metro Area - Overview
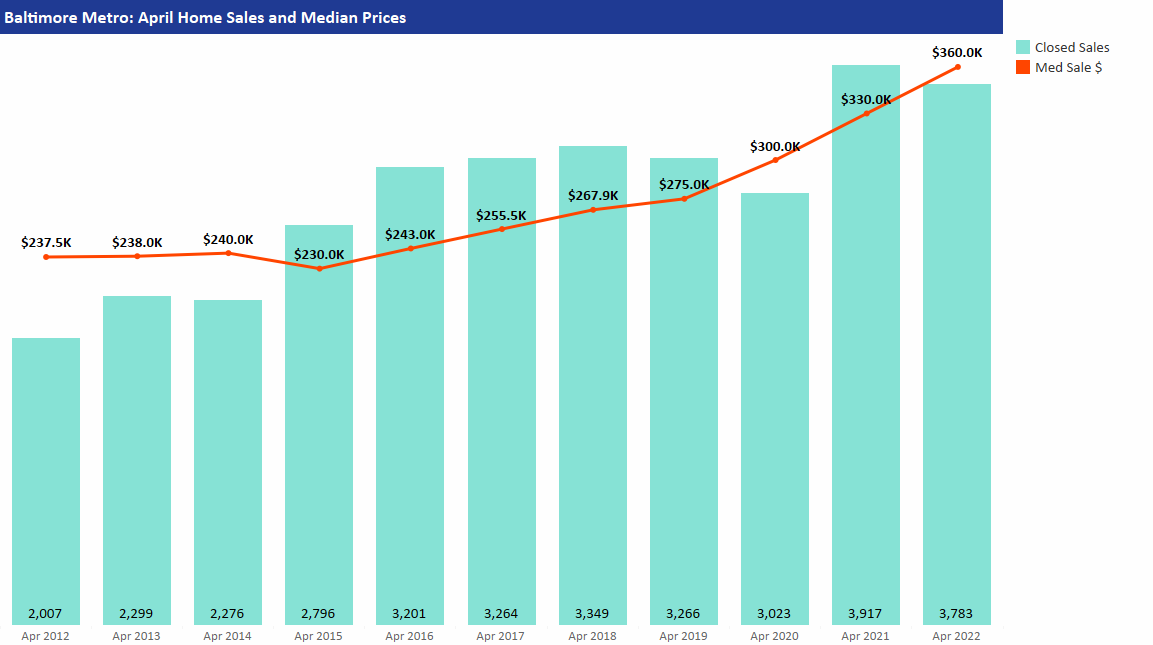
Home prices are up in the Baltimore region, with condominium price growth particularly strong in April.
- The Bright MLS | T3 Home Demand Index for the Baltimore Metro area rose 4.1 percent in April marking the fourth consecutive monthly increase since the seasonal low in December. The Index, at 127, reflected a Moderate pace of buyer demand in the region. While demand has been rising for the past four months, it has increased at a slower pace this spring than last spring.
- The region’s median sale price increased by 9.1% compared to a year ago, a gain of $30,000. The region’s median sales price is now $104,500 higher than it was five years ago.
- In April, sales were down 3.4% compared to a year ago. Sales were up between March and April; however, the month-to-month increase was lower than it is during typical years.
- Supply in the region has been declining since the middle of 2019; however, there are signs that inventory may be starting to stabilize in the region.
View the Monthly Market Report
About the DC Metro Housing Market Update
The DC Metro Area Housing Market Update provides unique insights into the state of the current housing market by tracking and measuring presale activities such as showings and agent searches through the Bright MLS | T3 Home Demand Index as well as the number of new pending sales, trends by home characteristics, and key indicators through the most recent month compiled directly from Multiple Listing Service (MLS) data in ShowingTime’s proprietary database. The DC Metro Area housing market includes: Washington, D.C., Montgomery County and Prince George’s County in Maryland, and Alexandria City, Arlington County, Fairfax County, Fairfax City, and Falls Church City in Virginia. Data provided by the Bright MLS | T3 Home Demand Index and by MarketStats by ShowingTime, based on listing activity from Bright MLS.
About the Baltimore Metro Housing Market Update
The Baltimore Metro Area Housing Market Update provides unique insights into the state of the current housing market by tracking and measuring presale activities such as showings and agent searches through the Bright MLS | T3 Home Demand Index as well as the number of new pending sales, trends by home characteristics, and key indicators through the most recent month compiled directly from Multiple Listing Service (MLS) data in ShowingTime’s proprietary database. The Baltimore Metro Area housing market includes the City of Baltimore, Anne Arundel County, Baltimore County, Carroll County, Harford County and Howard County in Maryland. Data provided by the Bright MLS | T3 Home Demand Index and by MarketStats by ShowingTime, based on listing activity from Bright MLS.
About Bright MLS
Bright MLS’s real estate service area spans throughout the Mid-Atlantic region, including Delaware, Maryland, New Jersey, Pennsylvania, Virginia, Washington, D.C., and West Virginia. As a leading multiple listing service (MLS), Bright supports over 100,000 real estate professionals in its footprint. In 2021, Bright's customers facilitated $142B in real estate transactions through its system. For more information, please visit www.brightmls.com.