

Want an easy, visual way to share what’s happening in your local market? New options are available for sharing the Home Demand Index directly with your clients.
NEWS
Pricing and sales rise, while demand slows
Bright Insights, July 2021: Is the market loosening its tight grip on buyers? Median sales prices and closed sales continue to rise, while demand begins to slow in many areas.
July reports are now available for the major metro regions in Bright. Read on for the latest from the Bright MLS T3 Home Demand Index and the Monthly Market Report, both free for you to use and share through your Bright MLS subscription.
Access these reports every month at: brightmls.com/marketinsights
Demand slowed for the second month in a row, as limited inventory continued across the Mid-Atlantic region.
Despite the slowdown, buyers are still searching. Demand slowed compared to the highs of the previous months, but still remains high overall compared to 2020.
Dive deeper into your market down to the ZIP code! View the Home Demand Index July 2021 Reports:
WASHINGTON-D.C.-METRO |
BALTIMORE-METRO |
PHILADELPHIA-METRO |
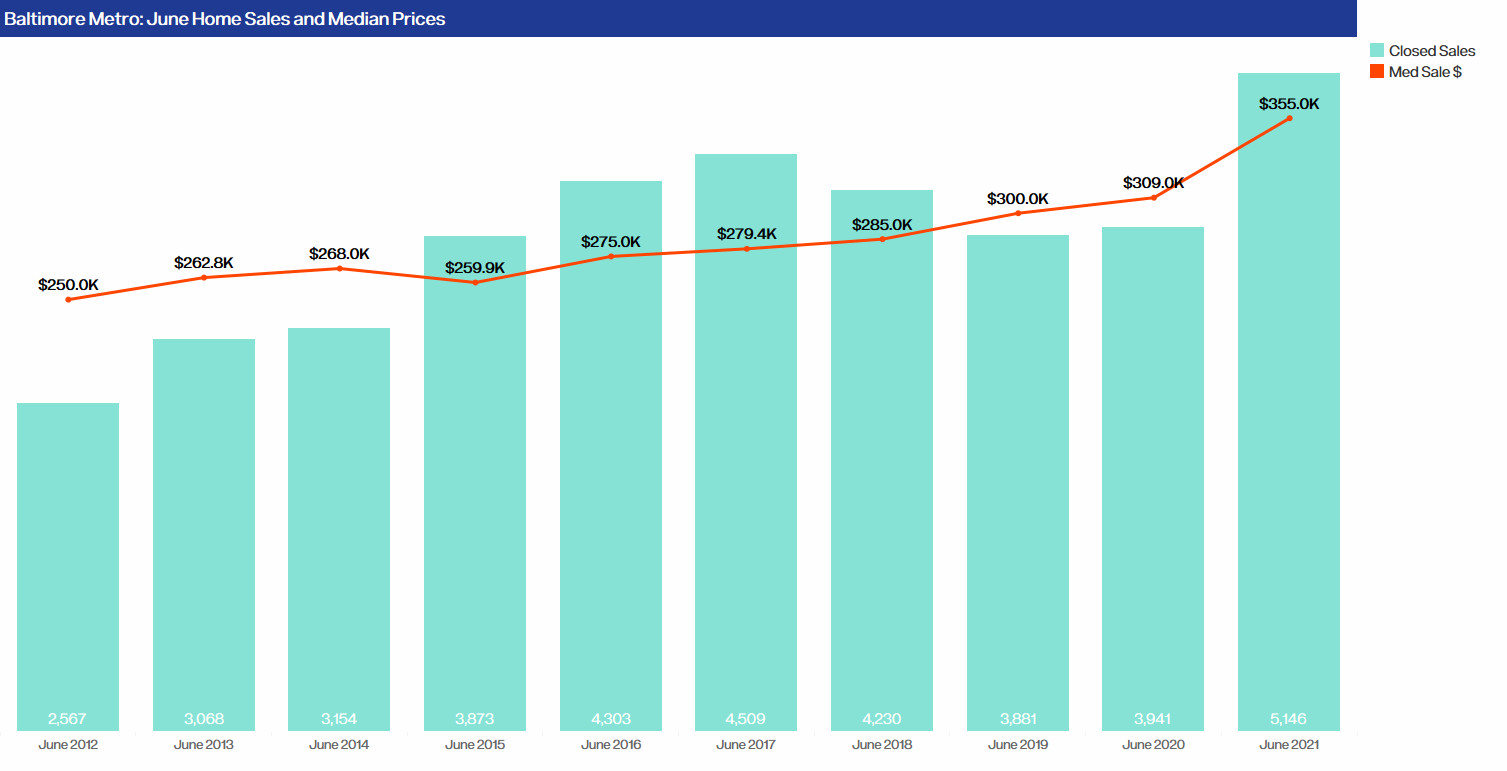
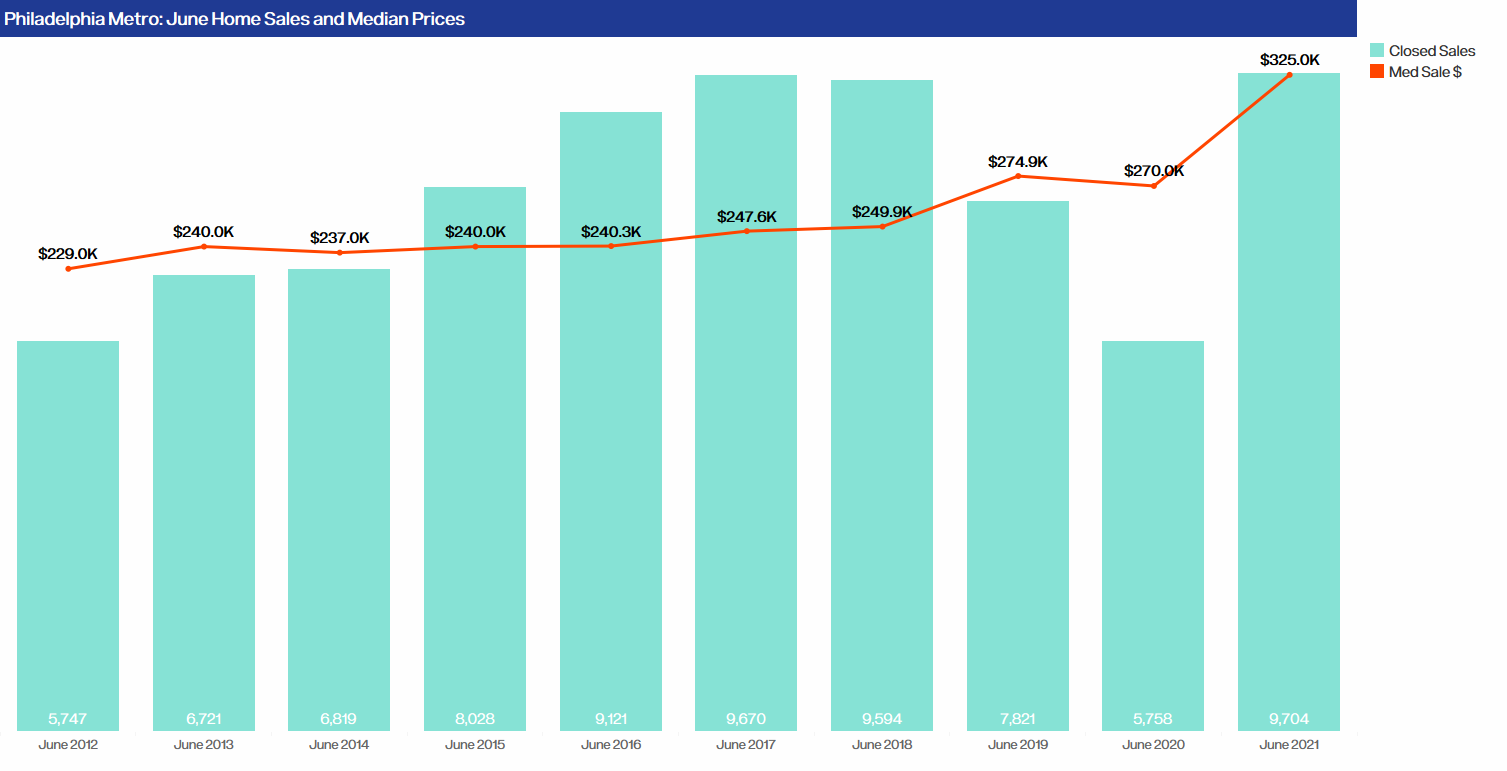
Median Sales Prices and closed sales continued to reach new records with closed sales hitting 10-year highs in both Washington D.C and Baltimore Metro Regions.
How did the market perform in June? Download the Monthly Market Reports:
| WASHINGTON D.C. METRO | BALTIMORE METRO | PHILADELPHIA METRO |
|---|---|---|
|
|
|
|
Want to see the statistics for your county?
Register for your free SmartCharts account to view monthly housing statistics for your county. And, if you want to dive even deeper, upgrade to SmartCharts Pro for zip code and school district-level statistics. Register today!
Recent articles
Looking for tools and tips to win clients over in this hot market? Look no further than the Bright T3 Home Demand Index included with your Bright subscription.
Back to Top