
Dr. Lisa Sturtevant has your Mid-Atlantic housing market forecast for the second half of 2022 and 2023.
NEWS
Inventory rises across all markets
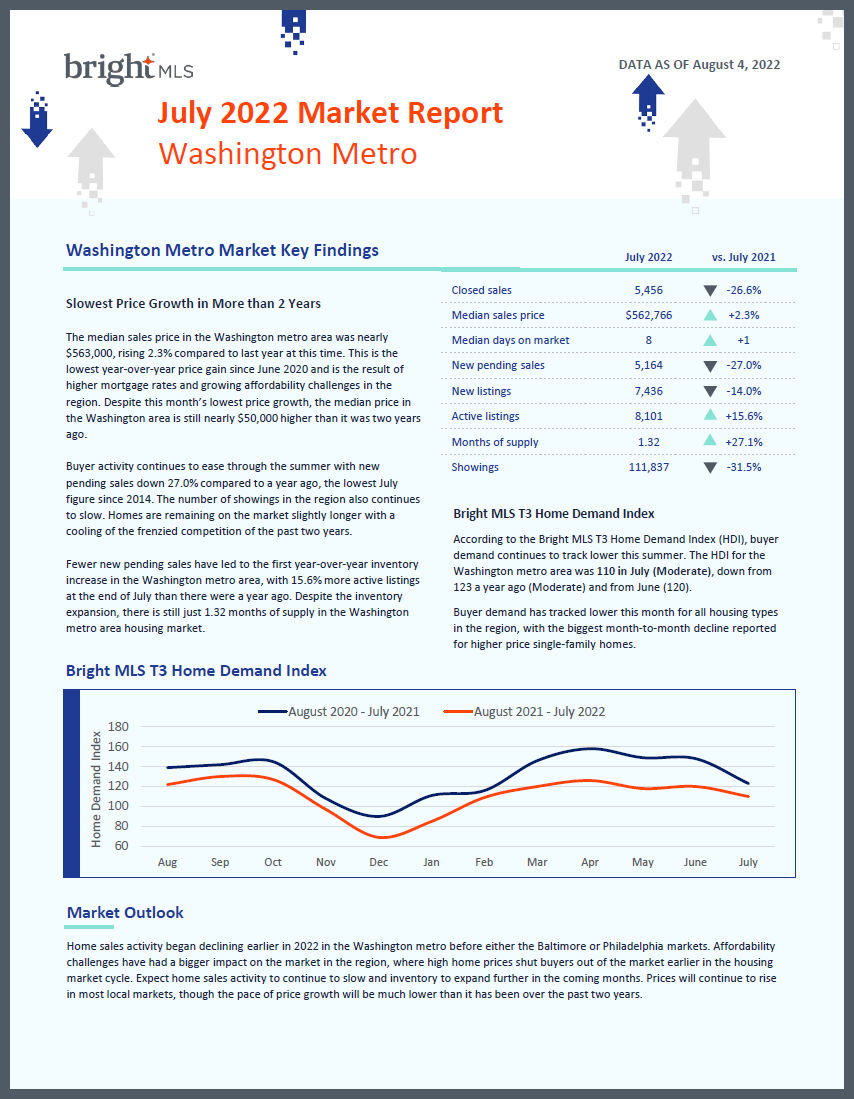
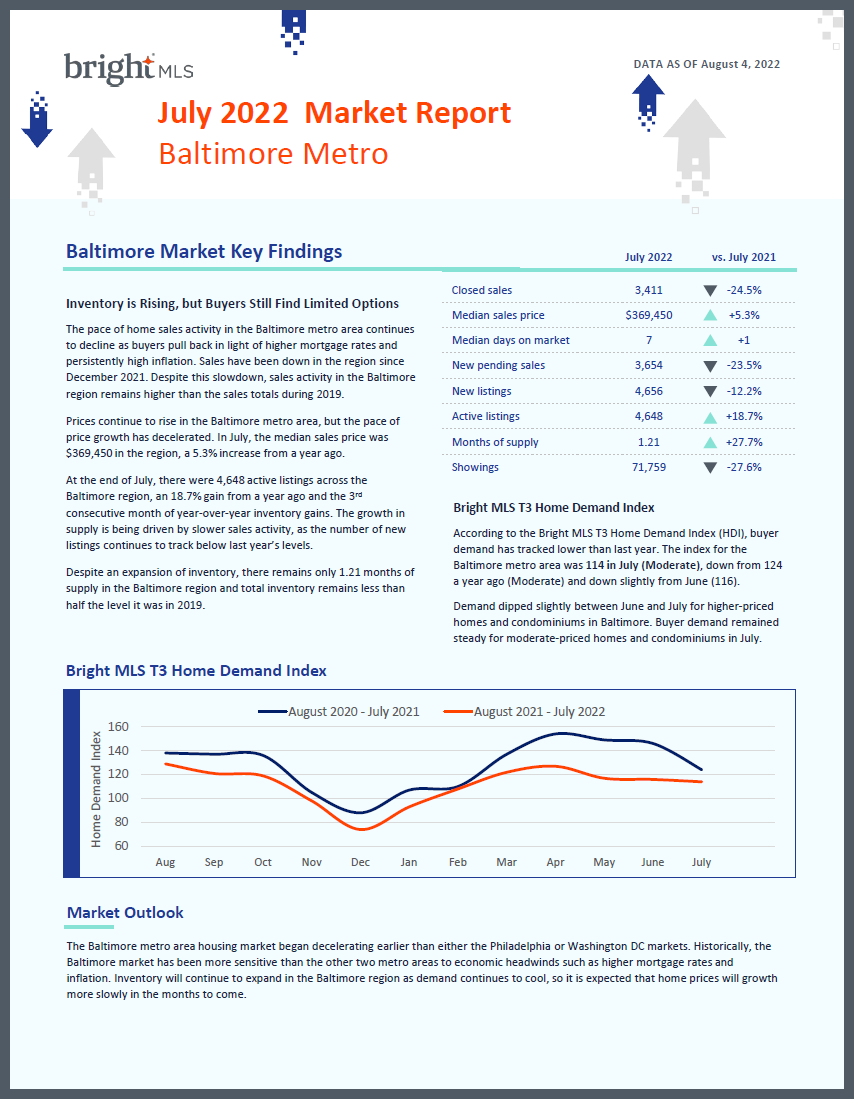
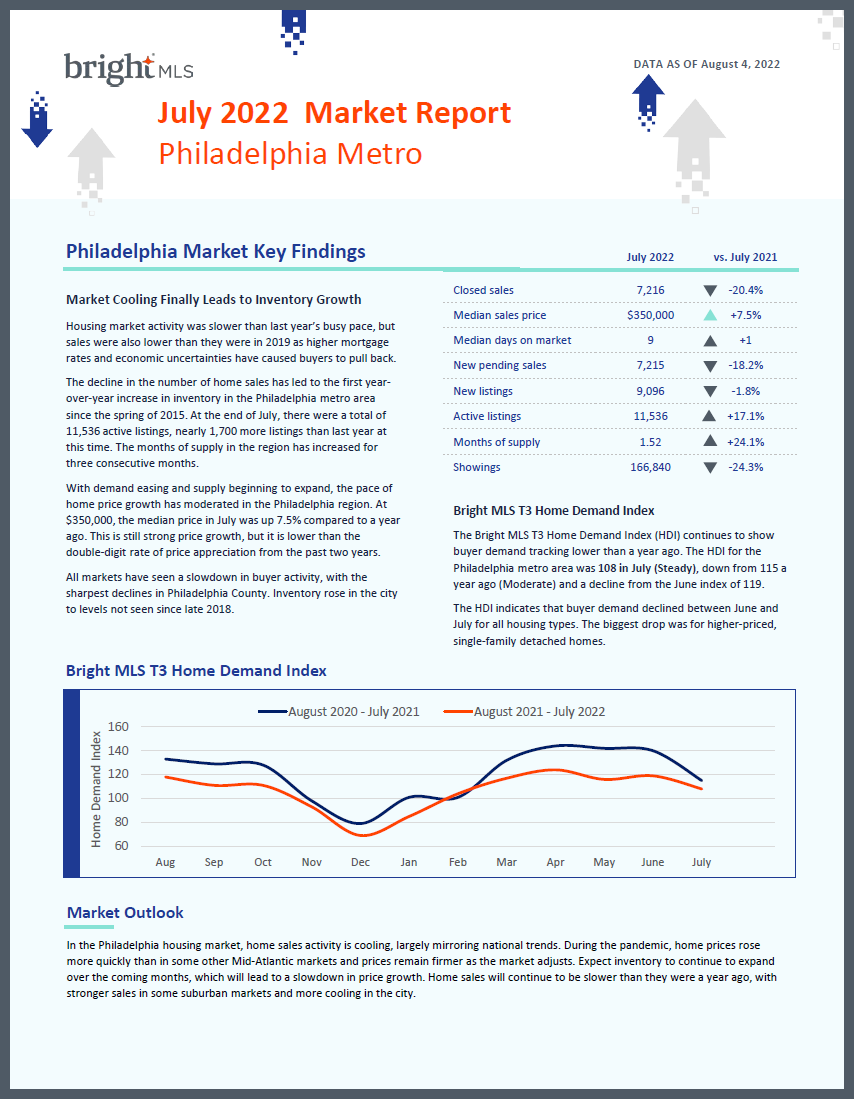
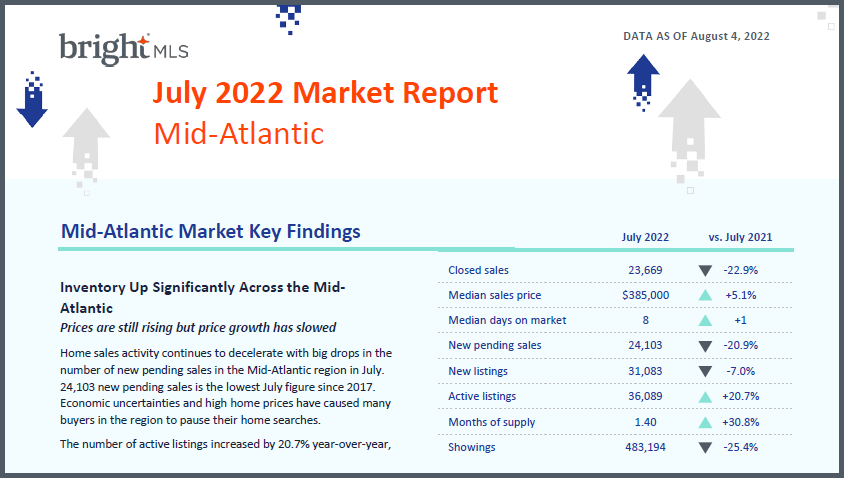
Bright Insights, July 2022: The Mid-Atlantic is seeing slower activity as rising mortgage rates and high inflation have caused buyers to pull back.
For the first time, the number of active listings increased across the Bright footprint.
Despite the inventory increases, there is still just 1.40 months of supply across the Mid-Atlantic, a lower level than in many other parts of the country. Prices continue to rise but at much lower rates than earlier this year.
How did the market perform in July? Download the Monthly Market Reports:
| WASHINGTON D.C. METRO | BALTIMORE METRO | PHILADELPHIA METRO |
|---|---|---|
|
|
|
|
Each of the major metros saw demand fall for nearly every home type in July.
Buyer demand moved from Moderate to Steady in the Philadelphia Metro and remained in the Moderate range for the Washington, D.C. and Baltimore metro areas. Across all metros, the HDI for higher-priced single-family homes remained in the High range.
Dive deeper into your market down to the ZIP code! Choose any area to view the Home Demand Index Reports. For help using the map, watch our video.
WASHINGTON-D.C.-METRO |
BALTIMORE-METRO |
PHILADELPHIA-METRO |
Shareable resources
Mid-Atlantic OverviewDownload the July 2022 report. |
 |
DOWNLOAD |
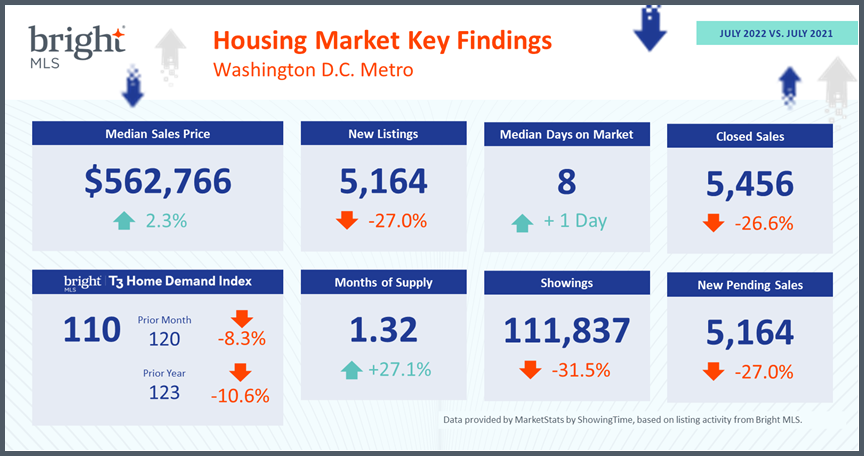
Key Findings - Washington, D.C.Download this graphic for the Washington D.C. Metro. |
 |
DOWNLOAD |
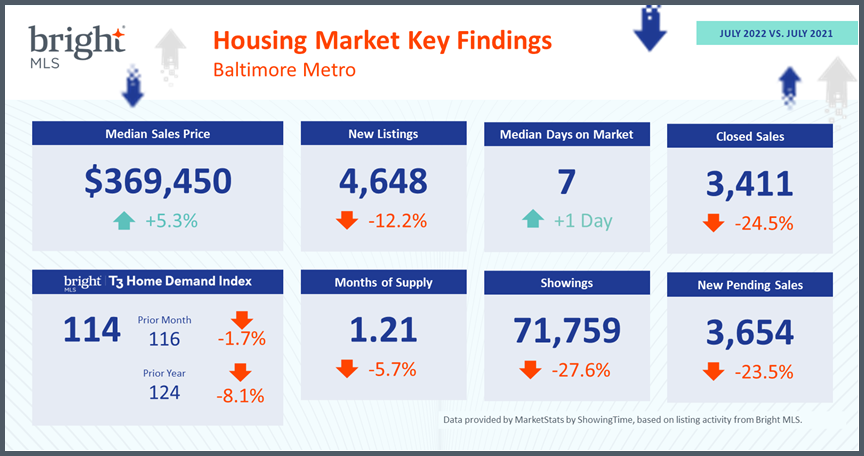
Key Findings - BaltimoreDownload this graphic for the Baltimore Metro. |
 |
DOWNLOAD |
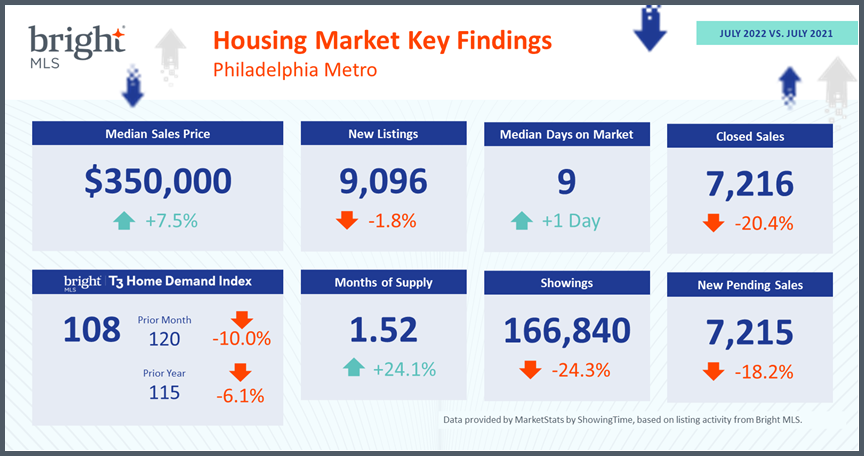
Key Findings - PhiladelphiaDownload this graphic for the Philadelphia Metro. |
 |
DOWNLOAD |
Weekly Market ReportAccess these reports for real-time data on residential market activity across the Bright footprint. |
 |
ACCESS NOW |
Want to see the statistics for your county?
Register for your free SmartCharts account to view monthly housing statistics for your county. And, if you want to dive even deeper, upgrade to SmartCharts Pro for zip code and school district-level statistics. Register today!
Get Answers from Our Expert
Have questions about the current housing market you'd like Bright's Economist, Lisa Sturtevant, to address in an upcoming article? Let us know!
Recent articles
Bright Insights, June 2022: Rising mortgage rates and growing economic uncertainties suggest the housing market will continue to adjust throughout the summer.
Back to Top