
Results from new Bright MLS survey show a surprisingly competitive Mid-Atlantic housing market.
NEWS
Competition cools, but some sellers continue to hold all the cards
Three in 10 homes sold in the Mid-Atlantic region in February 2023 received over their original list price.
Those who classify today’s housing market as one that favors buyers may need to rethink that statement. While it isn’t quite the 43% and 48% of homes that sold above their original list price in February 2021 and 2022, respectively, a decent number of sellers still have the upper hand — and they are getting paid for it.
In February 2023, 31% of homes sold in the Mid-Atlantic region received a price greater than their original list price. And an additional 16% of sellers sold at their asking price.
Competition hasn’t fallen to typical pre-pandemic figures in the Mid-Atlantic region. In February 2018 and 2019, only 18% of closed sales received more than the original listing price.
This is likely due in part to the restricted inventory levels of the current market. There were just 26,311 active listings in the region as of February 2023. In February 2018 and 2019, active listings topped 60,000 — more than double the current inventory level.
Some areas have more properties that close above their list price than the region as a whole. In the Baltimore metro, 36.8% of homes received over asking price, while in the Central PA metro, 36.1% did.
Meanwhile, Del Mar Coastal sellers may not have as much leverage as their metro peers. Still, 18.0% of homes there garnered a sale price higher than their list.
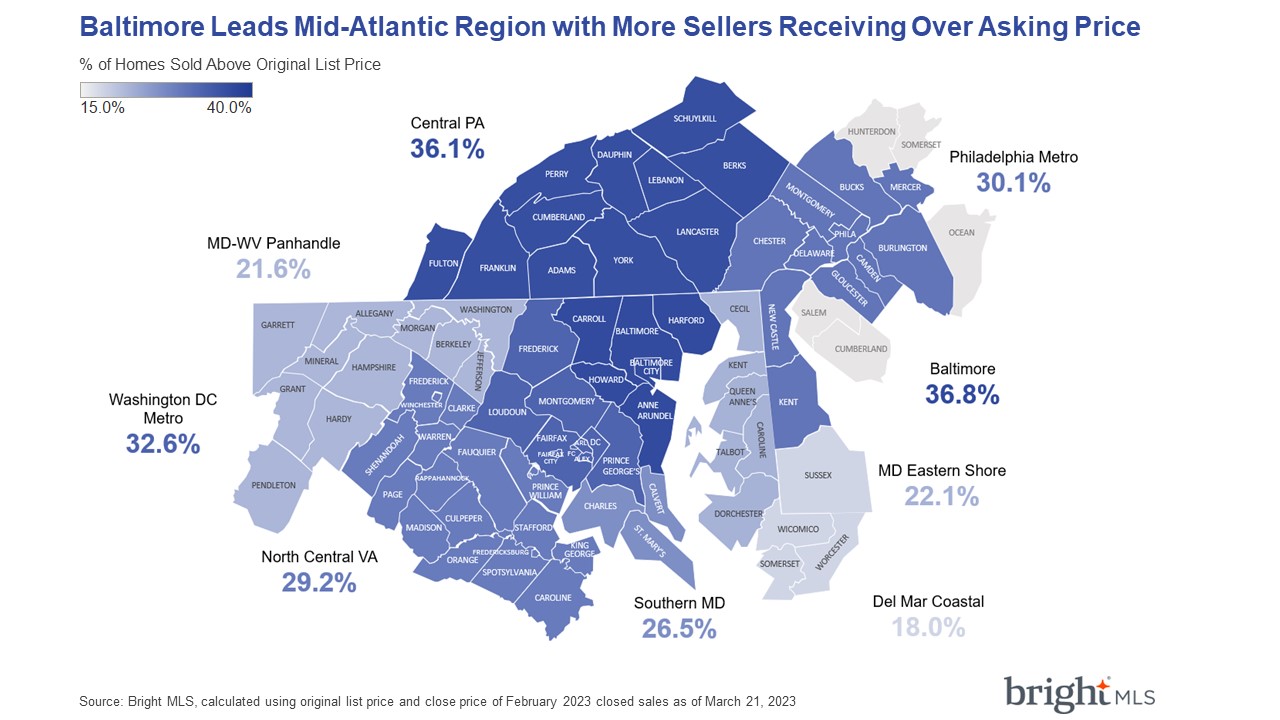
Setting expectations for sellers is an important part of a real estate professional’s job. While three in 10 sellers in the Mid-Atlantic received more than their list price, that leaves the remaining seven who did not.
The average sold price to list price ratio was 97.6% in February, indicating about a 3% discount. Candid conversations about the market can ease apprehension during a listing appointment. Save the map and bring your clients the latest facts to start the dialogue.
While this analysis focuses on metro areas, anyone in real estate will tell you it’s about location, location, location — and real estate is local. Look for an upcoming blog examining the breakdowns by county to see if yours makes the top 10.
Stay informed about housing market conditions with Bright’s housing market reports and get a preview of future buyer activity by tracking the Bright MLS T3 Home Demand Index for the Philadelphia, Baltimore, and Washington, D.C., regions.

Erica Plemmons serves Bright MLS as a Senior Economist. She delivers digestible market insights in the form of charts, blogs, and presentations from Bright’s comprehensive array of real estate data. In 2022, Bright’s over 100,000 subscribers facilitated $121B in real estate transactions through its system stretching across 6 states and the District of Columbia.
Exclusive Market Research & Analysis
For regular updates on the housing market, including weekly insights from Dr. Lisa, please visit BrightMLS.com/Research.
Recent articles
In the ramp-up to the spring market, higher mortgage rates led to a bumpy rebound across the Mid-Atlantic.
Back to Top